Assignment 3
Graphing a Quadratic in the xb Plane
by Debra Jackson
Investigation 1:
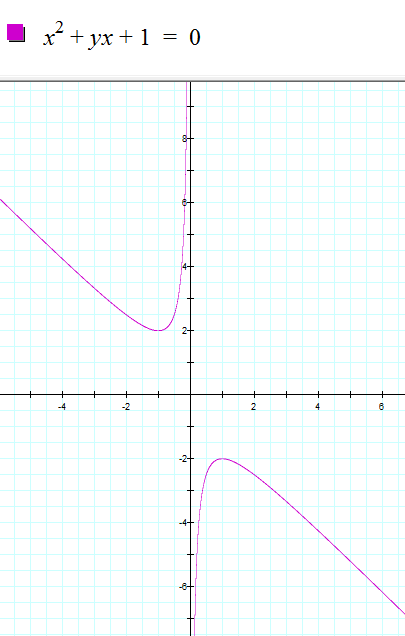
If we consider graphing x^2 + bx +1 = 0 in the xb plane for c values +1, -1, +5, and -5, the following graphs are produced.
 |
 |
 |
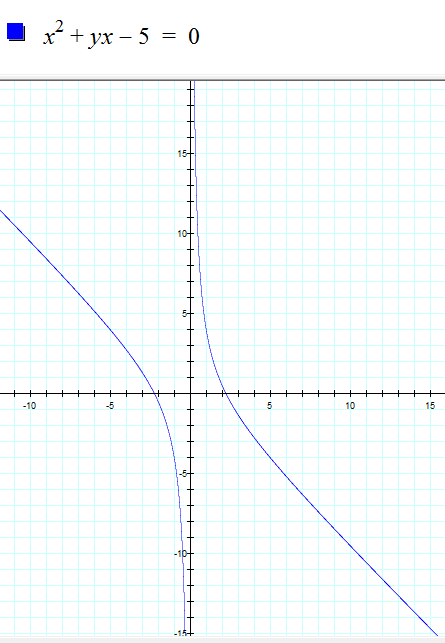 |
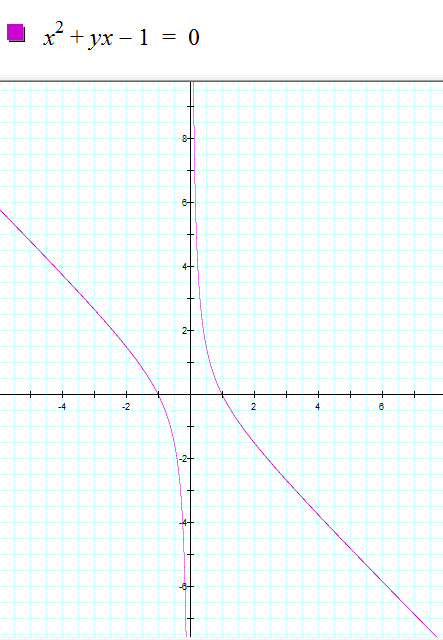
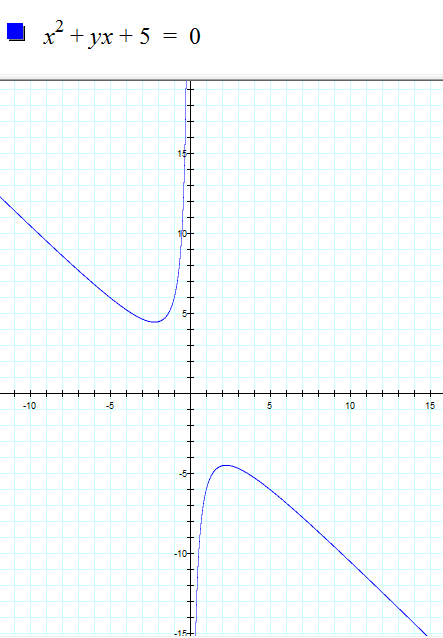
Conclusion: If c is positive, then the graph is a parabola. If c is negative, then the graph is a hyperbola.
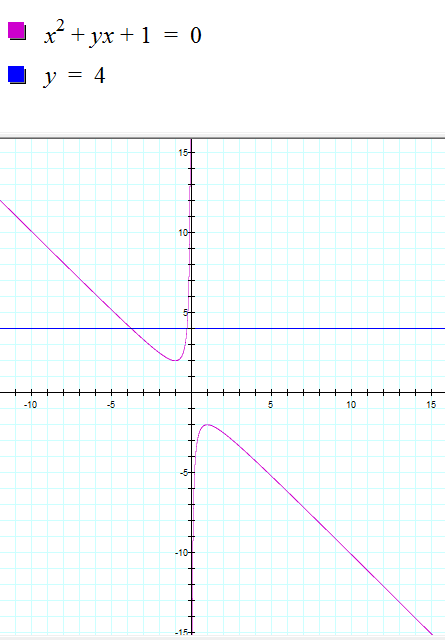
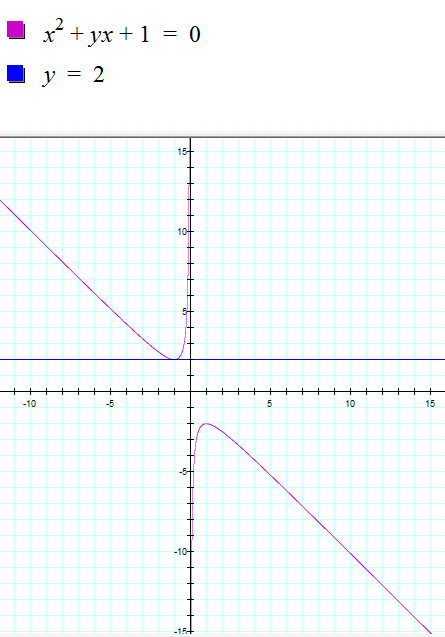
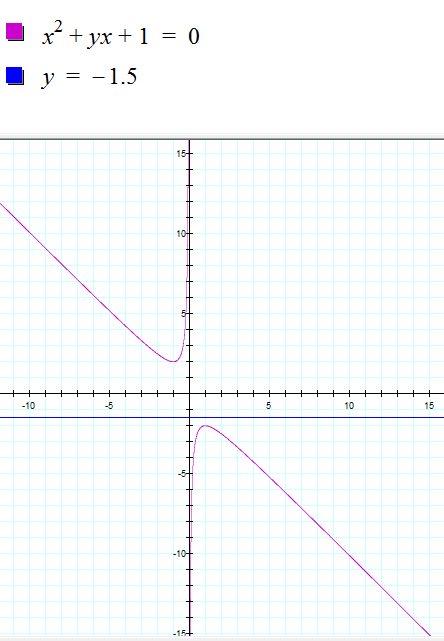
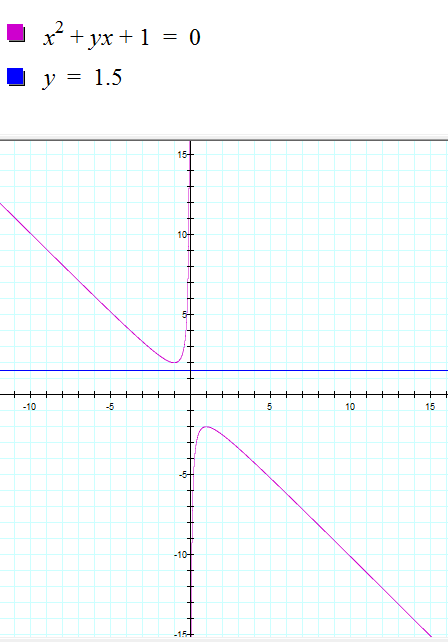
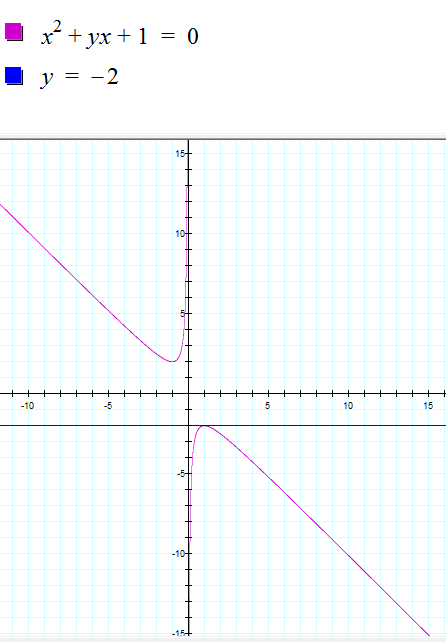
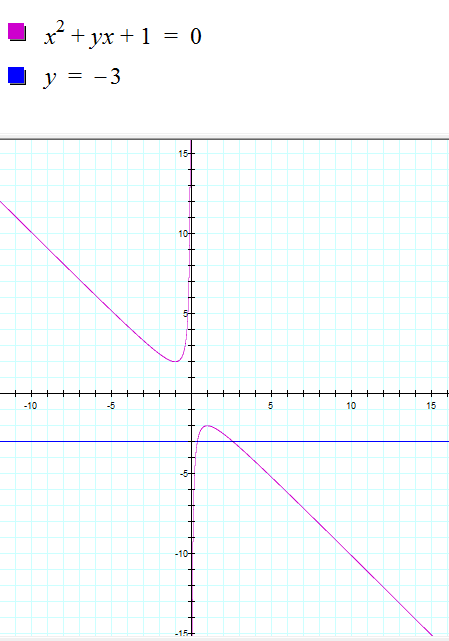
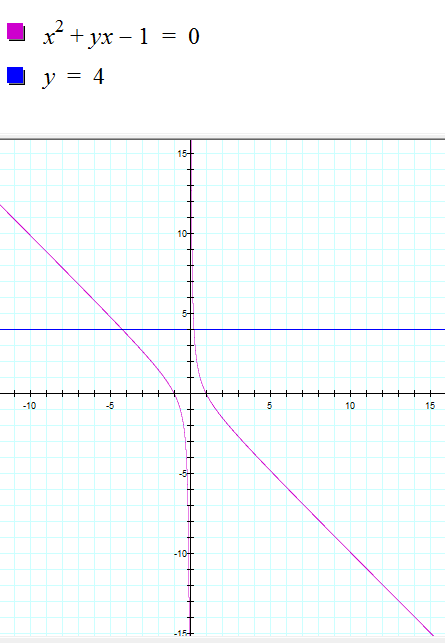
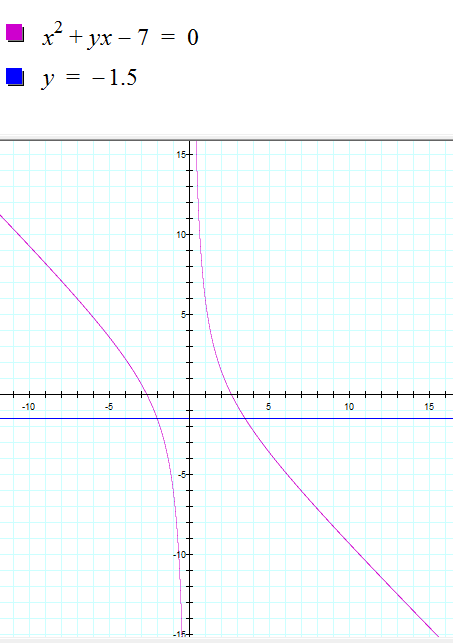
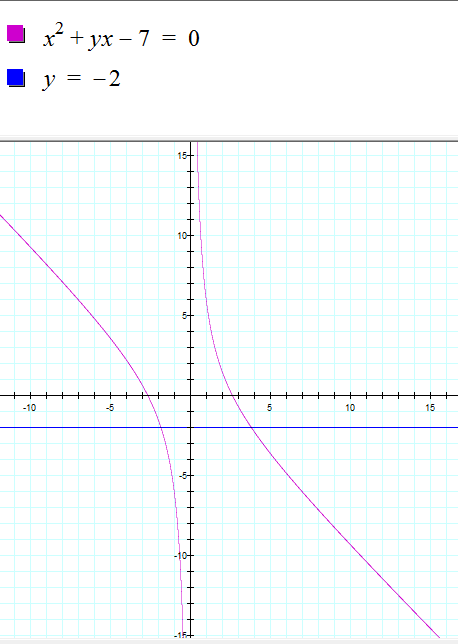
If we take any particular value of b, say b = 5, and overlay this equation on the graph we add a line parallel to the x-axis. If it intersects the curve in the xb plane the intersection points correspond to the roots of the original equation for that value of b. We have the following graph.
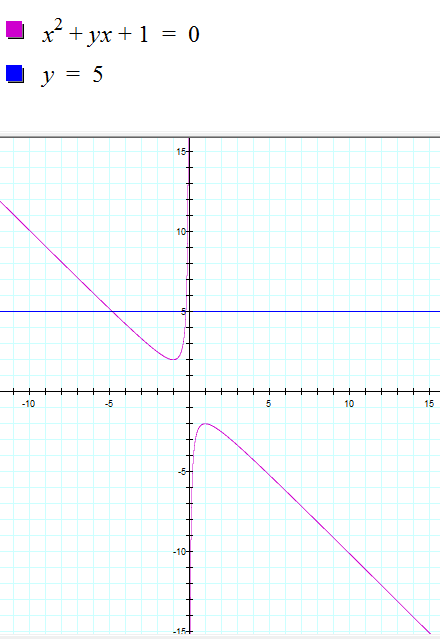
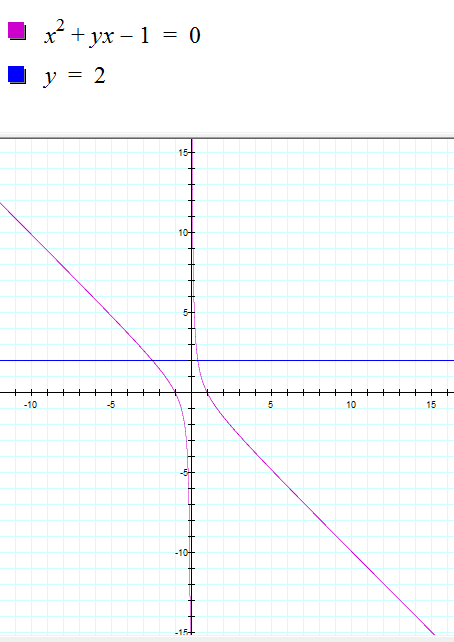
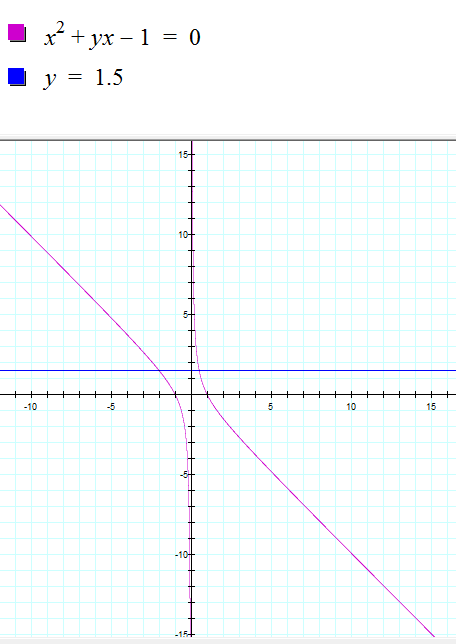
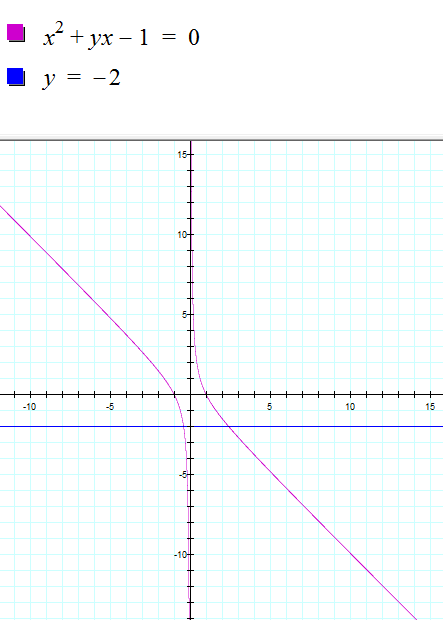
For each value of b we select, we get a horizontal line. It is clear on a single graph that we get two negative real roots of the original equation when b > 2, one negative real root when b = 2, no real roots for -2 < b < 2, One positive real root when b = -2, and two positive real roots when b < -2.
 |
 |
 |
 |
 |
 |
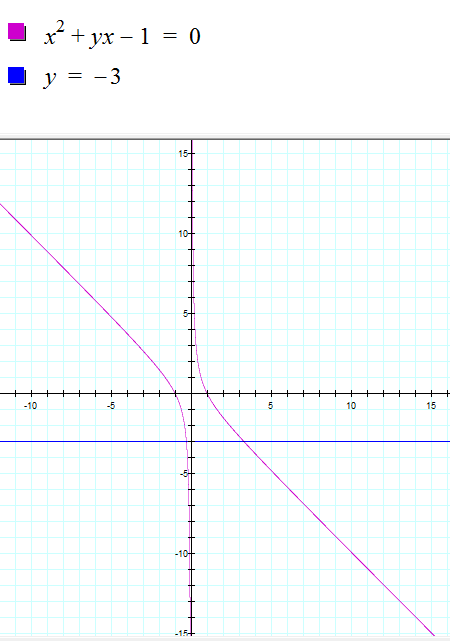
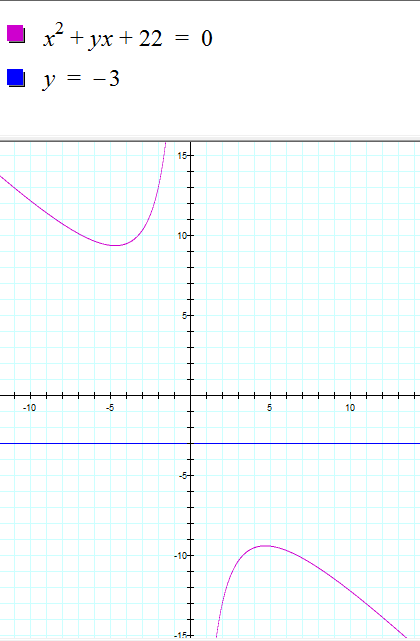
Consider the case when c = - 1 rather than + 1.
 |
 |
 |
 |
 |
 |
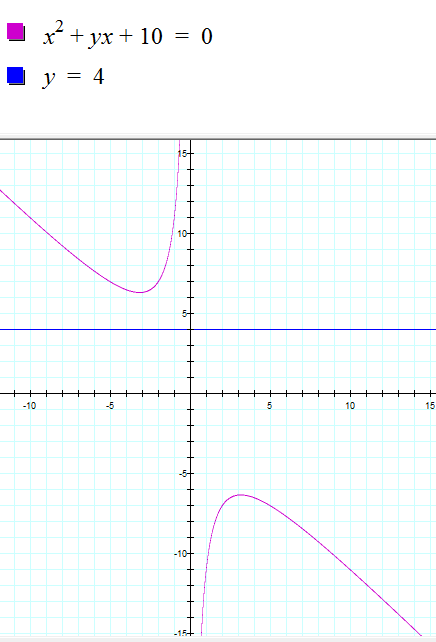
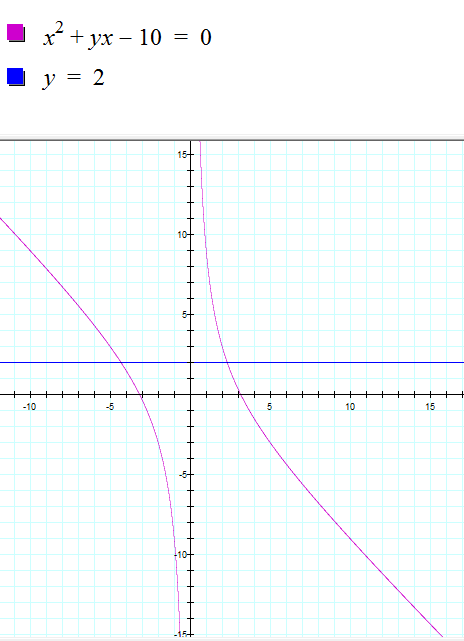
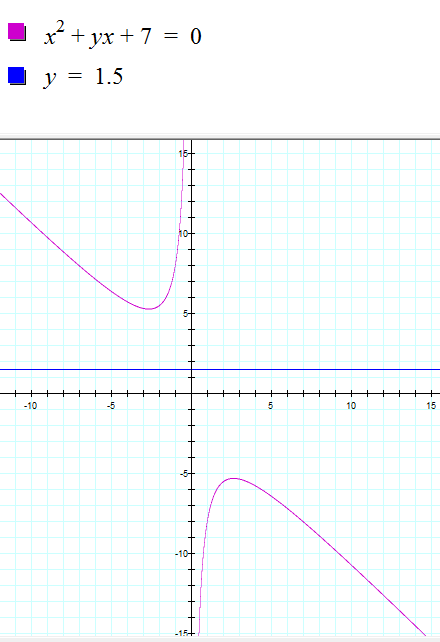
Graph other values of c on the same axes.
 |
 |
 |
 |
 |
 |
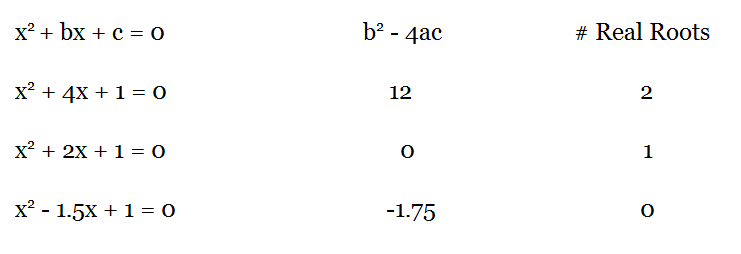
So, we have shown graphs of translations of x^2 + bx + 1 = 0 based on various values of b and c. Now, how do we determine the number and type of zeros or roots of the equation x^2 + bx + 1 = 0 in the xb plane and then how do we calculate these zeros or roots? We previously made some conclusions based on the graphs, but we can also make conclusions based on the discriminant portions of the quadratic formula.
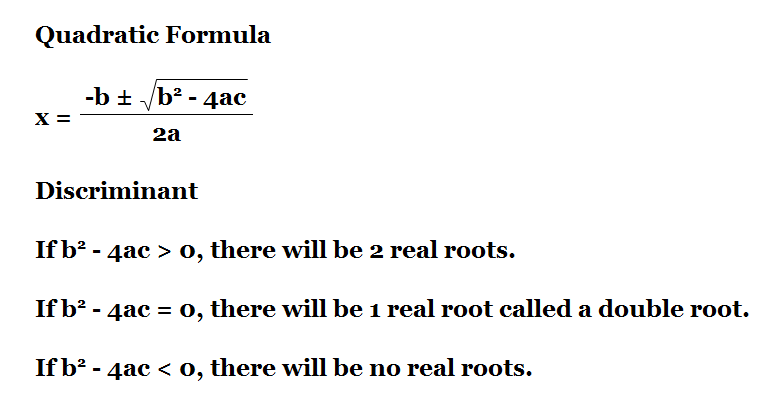
Below are examples correlated to graphs above.